If you’re old enough, you probably remember when Phil Collins and a band called Genesis were topping the charts in the mid 80’s. For the most part, they were an easy listening pop/rock band, but at one stage they strayed into the political arena with a song called ‘Land of Confusion’.
The tensions between the US and the USSR were high and a threat of nuclear war seemed a possibility. Phil and the boys questioned the wisdom of our world leaders and highlighted the mess the world seemed to be in.
There’s too many men
Too many people
Making too many problems
And not much love to go round
Can’t you see
This is a land of confusion.
The song wasn’t a massive hit, it reached number 4 in the US and 21 in Australia, but it was most memorable for the video which featured the Spitting Image puppets of world leaders. At the end of the video the Ronald Reagan puppet woke up from a bad dream and mistakenly pressed the nuclear button.
It’s an interesting reference point when it comes to investing. Turmoil tends to make investors nervous, with good reason. However, investors do tend to believe the geopolitical and economic events unfolding before them are the most significant the world has ever seen. It’s worth taking pause before holding firm on that viewpoint.
The Cuban missile crisis, JFK’s assassination and the escalation of the Vietnam War in the 1960s; the energy crisis, massive US trade deficits and a 10%+ US unemployment rate in the 1970s; the US savings and loans crisis, the attempted assassination of Ronald Reagan and stockmarket crash in the 1980s; the Gulf War, another US recession, the Asian financial crisis and Y2K in the 1990s; the dotcom bubble, 9/11, two more US recessions (one a global crisis) and corporate accounting scandals of the 2000’s. Despite all this turmoil, markets advanced and long-term investors made money.
Despite the heightened media coverage making it seem otherwise, there’s nothing particularly special about what’s currently occurring in the world. And the list above is only a few notable incidents from each decade. Yet if you start believing something particularly different is occurring or about to occur, you’ll be prone to look for further evidence and likely paralyse yourself into doing nothing – ever.
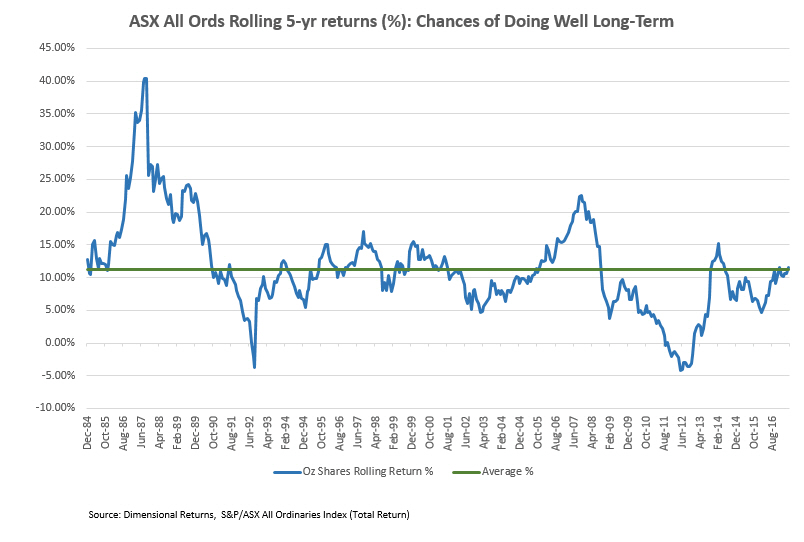
The following chart of the rolling 5-year performance of the ASX All Ords Accumulation index gives a good indication of the historical performance of the ASX. Every chart point is the end of a 5 year period. In some ways, it’s a better historical indicator than an average return because we don’t all start investing at just one point in time. The chart below shows the average return across the timeframe was just over 11%, but there were 5 year periods where you could knock it out of the park or alternatively step in doggy do-do at the park.

Yet the chance of stepping in doggy do-do was relatively small. Apart from two short periods over the past 30+ years, you could have invested at almost any time and made a profit if you’d stayed invested for at least 5 years. Underlining the importance of investing for the long term and not dwelling on President Trump’s 3am tweets.
You may say “what if I’d invested at one of those times and spent 5 years in the red?” First, equity markets come with risk and you can only find the worst times to invest in hindsight. Second, what are the odds you dump your whole net worth into one index at one of those specific times, without contributing another cent? Consistent contributions and investing across various asset classes will balance out one area being in the red and reduce the likelihood of a negative return.
The Land of Confusion shows we may not have advanced very far politically, but it’s never been much of a hindrance to our portfolios.
If you’re into nostalgia, enjoy.
This represents general information only. Before making any financial or investment decisions, we recommend you consult a financial planner to take into account your personal investment objectives, financial situation and individual needs.
