Economic Overview
In Q3, global economic data was mixed. There were positives from the world’s largest economy, depending on how you view positive economic data! In this case, the ongoing resilience shown by the US was combined with another bout of energy inflation, leading to concerns inflation may take longer to move back into the preferred range of the Federal Reserve. This has led to concerns that interest rates, while expected to be nearing their peak, may linger around their current level for longer. As noted, energy became a factor during Q3, as Saudi Arabia and Russia announced oil production cuts. This lifted West Texas and Brent Crude prices into the $90 a barrel range for the first time in nearly twelve months. Sharemarkets were mostly negative across Q3. Both Australian and global markets saw losses under 1%, with the falling Australian dollar offsetting some of the losses for unhedged global equities. The potential for further rate rises saw bond yields again moving upward, which continued the downward pressure on bond prices.
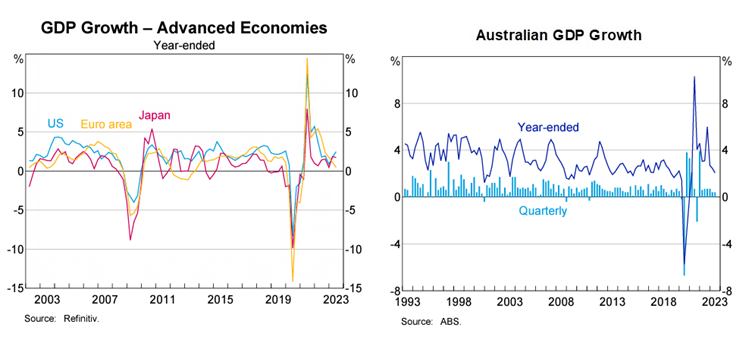
In the US, GDP grew at an annualised rate of 2.1% in Q2 2023, this was slightly down from the revised Q1 figure of 2.2% (previously 2.0%). Real-time GDPNow tracking for Q3 showed the US economy is still growing strongly. Consumer spending, growing at 0.8% and government spending, 3.8%, both fell sharply during Q2. The strongest contributors to GDP growth in Q2 were business investment in structures, equipment, and intellectual property. Spending on structures continued the recent strong trend, while the investment in equipment reversed Q1’s weakness in the area.
After falling to 3% in June, annual inflation subsequently increased to 3.2% in July and 3.7% in August. While declines in energy prices helped lower the headline number in Q2, the sharp reversal of energy prices in Q3 accounted for half the increase in inflation. Another ongoing contributor to inflation has been the shelter index. This accounts for over a third of CPI, and has now increased for 40 straight months. The US labour market remains strong despite the unemployment rate rising by 0.3% to 3.8% in August. The Federal Reserve voted to increase rates by 0.25% in July, bringing the discount rate to 5.5%. At the September meeting the Fed paused, but officials conveyed their intent to keep rates elevated for a longer time than previously anticipated.
Finally, the US national debt surpassed $33 trillion for the first time in the quarter, reaching $33.04 trillion in September. While the dramatic increase in federal spending between 2019 and 2021 has been a large contributor, the US has been running budget deficits stretching back to 2002.

Source: RBA 2023
In the Eurozone, data showed a region somewhat stuck in the mud. Purchasing Managers’ Index data showed contraction in the private sector, although the composite reading did increase from to 47.1 in September from 46.7 in August. The European Central Bank increased rates twice during Q3, with September’s increase being the 10th consecutive hike. This was despite eurozone inflation falling to 4.3%, a two-year low. Business surveys during the quarter showed confidence was at a ten-month low, this is reflected in the fact that Germany has not seen a positive quarter for GDP growth since Q3 2022, well surpassing the technical definition of a recession. The ECB also significantly revised its GDP growth forecasts across the region, expecting 0.7% in 2023, 1.0% in 2024, and 1.5% in 2025.
In the UK, the inflation remained high, but spent the quarter on a downward trajectory. July’s data, for the headline number showed that inflation had fallen from 8.7% to 7.9%, and finished the quarter at 6.7%. The major talking point was the last core figure (excluding energy, food, alcohol, and tobacco) coming in at 6.2% and below market expectations of 6.8%. The Bank of England then held rates for the first time in almost two years, at 5.25%, but September’s meeting showed the decision was only five to four in favour of the pause. However, economic data continued to struggle, and while it looks like the UK will narrowly avoid a technical recession, the suggestions are it’s in for a prolonged period of stagnation. Expectations are for slow growth, with inflation and interest rates remaining higher for longer.
In Japan, the Bank of Japan continued to maintain its ultra-loose policy by keeping short-term interest rates at –0.1%, citing “extremely high uncertainties” on the outlook for growth both domestically and globally. There were suggestions that BOJ Governor Ueda could announce an end to negative interest rates by the end of the year, but the bank’s forward guidance of “take additional easing measures without hesitation” if needed, did not change. Inflation remains solid with the August number coming in at 3.2%, slightly down from July’s 3.3%. Geopolitical tensions with China sparked during the quarter, as Japan announced that the water stored at the Fukushima nuclear site would be released into the ocean.
In China, concerns in the property sector, which accounts for over a third of GDP, resurfaced again, and the central bank announced that it would again cut the reserve requirement ratio for most banks to boost liquidity and support economic recovery. China’s annual GDP grew at 6.3% in Q2, which was up on 4.5% in Q1, although the PMI manufacturing index entered its fifth straight month of contraction in August as the reading remained below the 50-point threshold. Government officials have acknowledged that the economy is facing headwinds, but still expect growth to reach the 5% target for 2023. Many analysts are less optimistic, given weakening demand for Chinese exports in other major economies.
In Emerging Markets, there were concerns that strength in the US economy could lead to interest rates being higher for longer. In Poland, political uncertainty ahead of October’s elections prompted an unexpected and poorly received interest rate cut. Macroeconomic data was mixed in Mexico while Korean economic growth slowed as exports struggled. South Africa continued to be plagued by an ongoing electricity crisis. Brazil saw an improvement in economic data as its central bank cut rates. Growth forecasts for the coming year are the strongest in emerging Asian economies and weakest in Europe.
Back in Australia, data released in September showed GDP increasing by 0.4% for Q2 2023, with the economy growing by 3.4% over the financial year. GDP per capita, often a proxy for living standards, fell 0.3%. Inflation data was mixed, with monthly CPI coming in at 5.4% for the year ending June 2023, the July reading dropped to 4.9%, but August moved back up to 5.2%. While June and July saw transport costs, or fuel specifically fall, a large spike in the cost of fuel played a role in the August inflation increase. The savings rate fell to 3.2% in Q1 23 and is now at the lowest level since June 2008. The RBA held interest rates across the quarter, in what were former Governor Phil Lowe’s final three monetary policy meetings before being replaced by new Governor Michelle Bullock. The board reaffirmed its prior statement that “some further tightening of monetary policy may be required to ensure that inflation returns to target in a reasonable timeframe” in the September meeting.
The housing market continued its upward momentum, though there has been a notable capital vs regional divergence. Sydney was up 2.5% for the quarter and 7.3% annually, according to CoreLogic. Nationally, dwelling values were up 2.2% across the quarter with every capital registering a gain except Hobart, down -0.2%. The strongest markets for the quarter, were Adelaide at 4.3%, and Brisbane at 3.9%. The combined capitals were up 2.5% with regionals up 1.1%. Hobart saw the largest fall on an annual basis, down -7%. CoreLogic noted listings in Hobart were 40% higher than the five-year average, going someway to explain that price weakness. The Albanese government announced a housing package to fast track 1.2 million new homes during the quarter, but with the government’s foot to the floor on immigration the skeptics suggest even if the ambitious housing target were hit, it would be overwhelmed by the ongoing supply of people needing accommodation.
Market Overview
Asset Class Returns
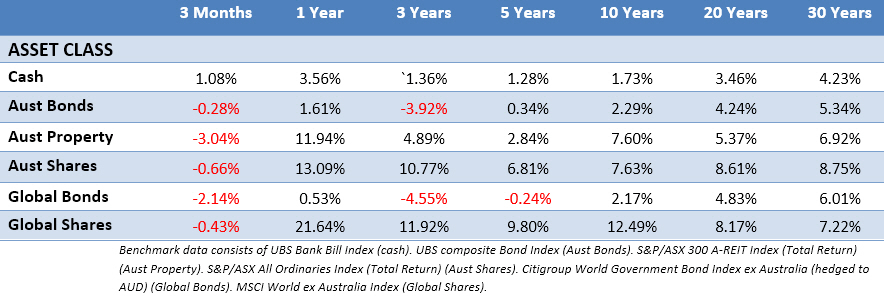
The following outlines the returns across the various asset classes to 30 September 2023.

Global sharemarkets struggled in Q3 with several headwinds, such as the inflationary pressure from rising energy prices, interest rates being higher for longer, a tepid economic recovery in Europe and property concerns in China, all at play. The Australian market was down less than 1% for the quarter, while Australian listed property continued it see-saw behaviour. Bond prices fell again across Q3, as longer dated yields continued to push upward in the US with elevated longer term rate expectations. The 10-Year US Treasury yield started Q3 at 3.84%, finishing the quarter on its high of 5.58%. US 2-year yields moved up slightly across Q3 from 4.9% to finish at 5.05%. In the UK, the 10-year yield movement was more tepid going from 4.39% to 4.44%, while the Australian 10-year yield had more momentum moving from 4.03% to finish the quarter at 4.5%.
In the US, the S&P 500 fell -3.27% for the quarter, but is still up 13% year to end of September. The Magnificent Seven of Apple, Microsoft, Alphabet, Amazon, Tesla, Nvidia and Meta all declined, which weighed on the market. The Russell 2000 small-cap index was down -5.1% in Q3. Overall, the IT sector was one of the weakest, as the AI-driven rally has faded and higher interest rates weighed on valuations. Consumer discretionary experienced a similar trend, as guidance points toward a weakening outlook, despite strong earnings results. Real estate and utilities also struggled. Energy companies had a strong quarter thanks to the increase in oil prices, with the sector up 12.9% for the quarter. Earnings reports for Q2 showed a higher-than-average number of companies reporting positive earnings surprises. Just under 80% of companies beat earnings estimates while 17% missed.
In the Eurozone, the region’s equities were the worst performers across the major markets. In France the CAC 40 was down -3.58%, while the German DAX was down -4.71%. Markets followed a similar path to other regions, some gains in July, before economic data began to weigh, and the bigger falls coming in the final weeks of the quarter. The largest declines came from the consumer discretionary sector given concerns over higher interest rates and disposable income. As with other regions, the energy sector was a notable winner, as some oil exporting countries cut production. Financials also did well, as earnings results highlighted banks were benefiting from rising rates.
In the UK, large cap equities bucked the downward trend of other markets, with the FTSE 100 notching a 1% gain for Q3. Although the mid cap FTSE 250 was down -0.75%. Energy and materials companies outperformed as both rebounded from weakness seen in Q2, the recovery in oil prices underpinned energy companies. Both also benefited from pound weakness against a strong US dollar. Several domestically focused areas also saw a recovery after a poor Q2, as there were signs of improving UK consumer confidence as hopes that rates may have peaked. Consumer discretionary areas recovered well, with travel and leisure companies, such as pub groups and transport operators, outperforming.
In Japan, large companies were impacted by the sell off, with a -4% decline for the Nikkei 225 index. In contrast, smaller companies held up well, and value companies surged. This took the TOPIX Total Return index to a 2.5% return for Q3. Quarterly earnings results, announced from late July to August, showed solid figures, ahead of expectations. Results were supported by the weakening yen, along with strong domestic demand. As with other regions, financials and energy did well.
Asia (ex-Japan) and Emerging markets were broadly down across Q3 despite a strong start to the quarter. Poland and Chile posted large declines, as Chile was hurt by falling lithium prices and Poland suffered from political uncertainty. Chinese stocks experienced sharp declines in August, as the property sector weighed heavily, and investors doubted that Beijing will deliver enough stimulus to put the economy back on track. The Hong Kong market was also sharply lower as embattled Chinese property company Evergrande was suspended from trading following sharp price falls. South Korea also struggled, as weaker factory output and slowing retail sales in the country spooked investors. The winners were Colombia, Hungary, the Czech Republic, who all outperformed the EM index, with India, UAE, Egypt and Turkey also posting strong returns.
The Australian market (All Ords Accumulation) was down -0.66% in Q3. Like other countries and regions, the ASX got off to a strong start in July, but then spent August and September giving back those early gains. The big winner was energy, as expected, with a double digit return for the quarter, followed by consumer discretionary which benefited from the pause in rates. Financials were the only other sector in the green for the quarter, which helped minimise the overall losses. Information technology, consumer staples and health care were the worst performers. The heavyweight CSL has been a notable drag on the healthcare sector this year and continued to fall in Q3.
SPIVA Mid-Year
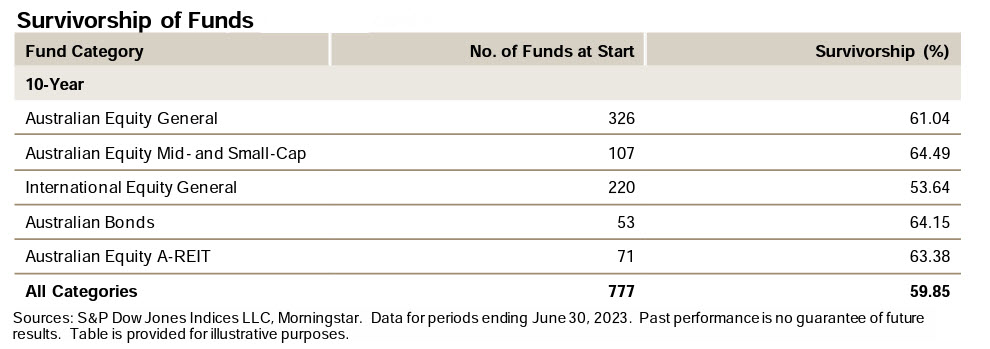
The SPIVA Mid-Year report was released during the quarter. We’ve talked about it many times before, it’s an ongoing scorecard measuring the performance of Australian actively managed funds against their respective benchmarks. In terms of the funds vs benchmark comparison, there were no surprises. It again showed, across nearly every category measured, that as time goes on it becomes harder and harder for an actively managed fund to outperform its benchmark.
This time we’ll briefly discuss another aspect of the report that’s often overlooked: fund survivorship. SPIVA also keeps a tab on the number of funds in each category that still exist after 1, 3, 5, 10 and 15 year periods. From their own definition “the survivorship measure represents the percentage of funds in existence at the beginning of the time period that are still active at the end of the time period.” Why do SPIVA do this? As they again note “many funds might liquidate or merge during a period of study. This usually occurs due to continued poor performance by the fund.”
This highlights why fund selection is important on a reliability basis because consistency is important. Our eyes will often gravitate to the short term winners, but it’s important to remember significant outperformance can also risk significant underperformance. The last thing an investor wants is their fund to shut up shop and leave them with an unexpected capital gains hit. A fund liquidation will also prompt the follow-up decision of where to reallocate that money.
While every manager would have started a fund with the best of intentions, to see 40% of all funds gone after 10 years might raise your eyebrows. Logically you might think it hasn’t exactly been hard to get a decent return over the past decade, which would leave you wondering why so many funds disappeared?
That’s the issue. The market’s done well and an investor didn’t have to do anything to get a decent return. For an active fund manager, that’s going to be hard to beat! Conversely, when markets are bad, active managers are then faced with the question of why they aren’t doing better, given they’re paid for their expertise.
It’s a ruthless business and over the long term it takes no prisoners. Those that can’t keep up, are wiped out.

This material is provided for information only. No account has been taken of the objectives, financial situation or needs of any particular person or entity. Accordingly, to the extent that this material may constitute general financial product advice, investors should, before acting on the advice, consider the appropriateness of the advice, having regard to the investor’s objectives, financial situation and needs. This is not an offer or recommendation to buy or sell securities or other financial products, nor a solicitation for deposits or other business, whether directly or indirectly.
